In some cases we might need to know what happens in the background when some function is performed in M3. For an example we will assume that we need to identify the tables that are getting updated when we create a record in CRS140 program.
There is an option in Life Cycle Manager that can be used to perform this task. In this post we will discuss how this option can be used.
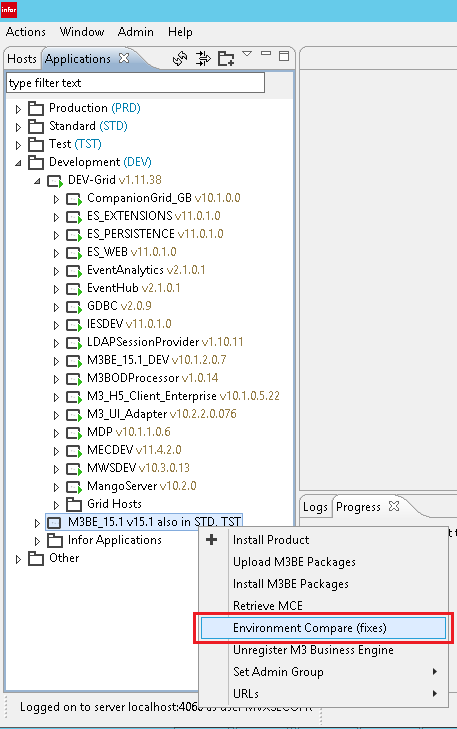
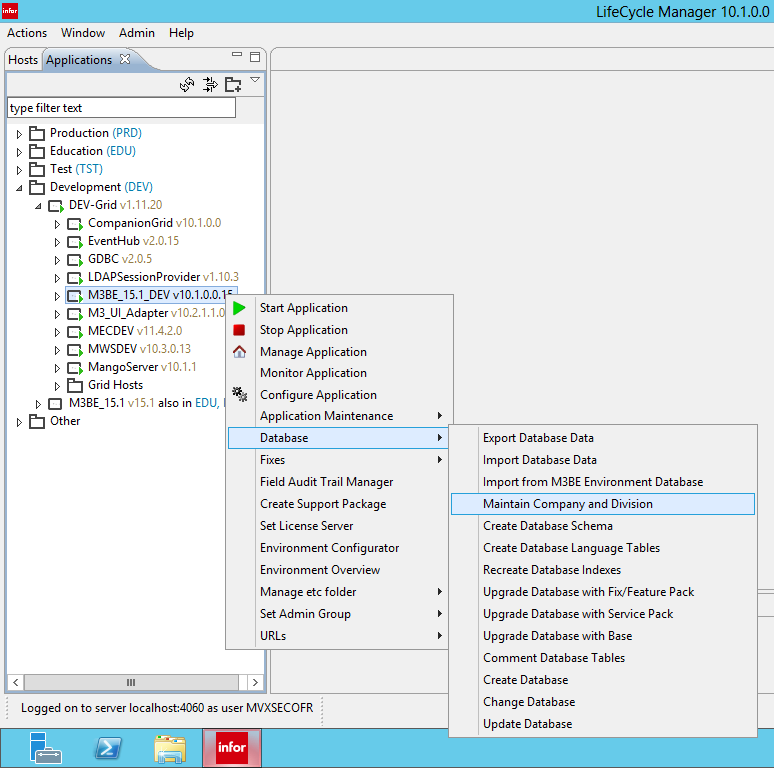
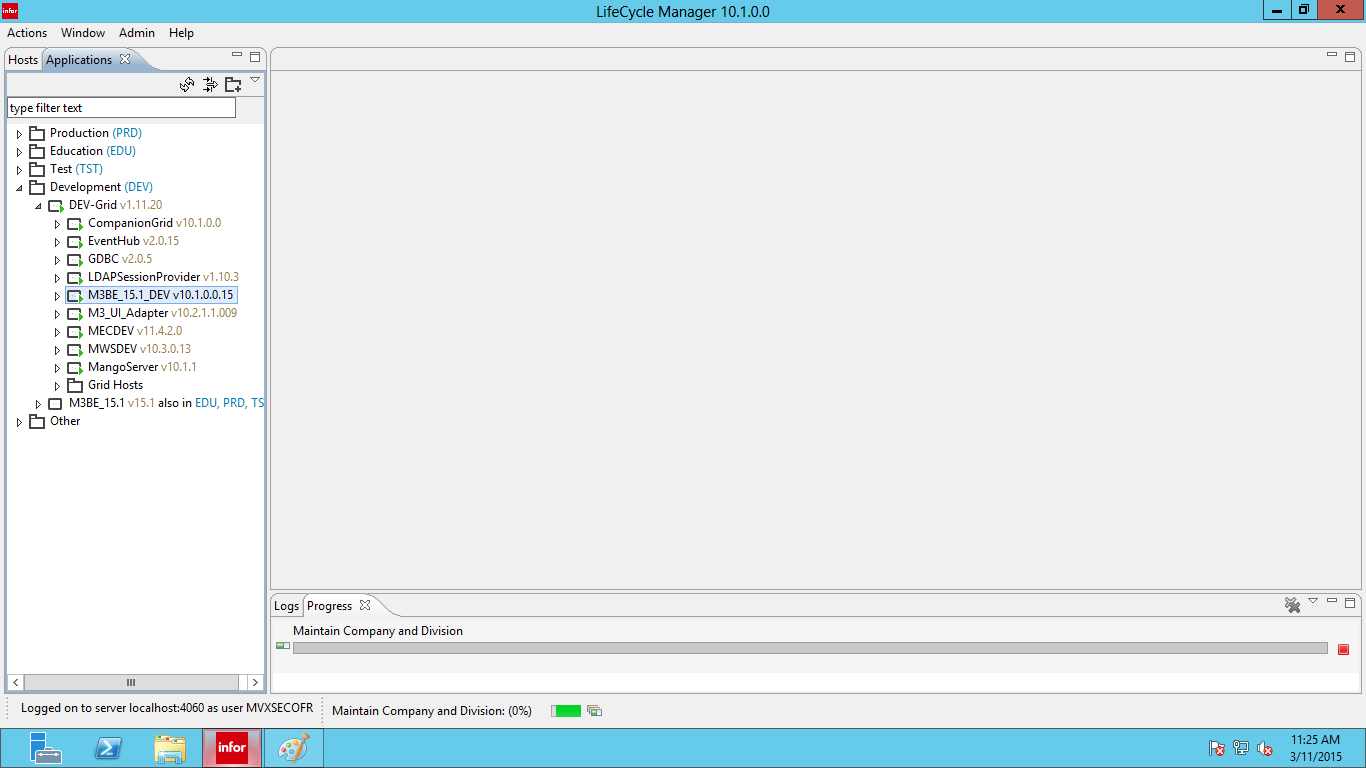
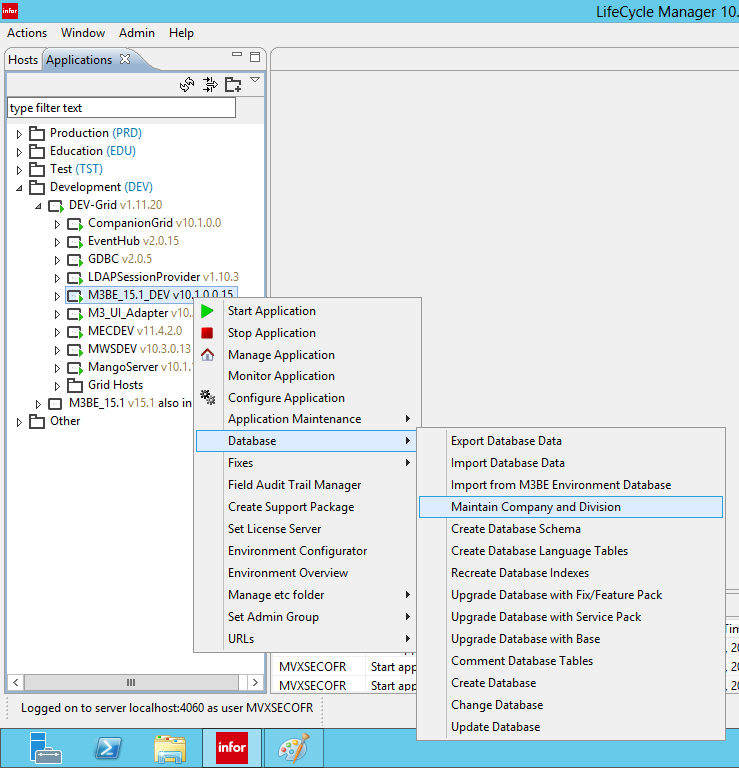
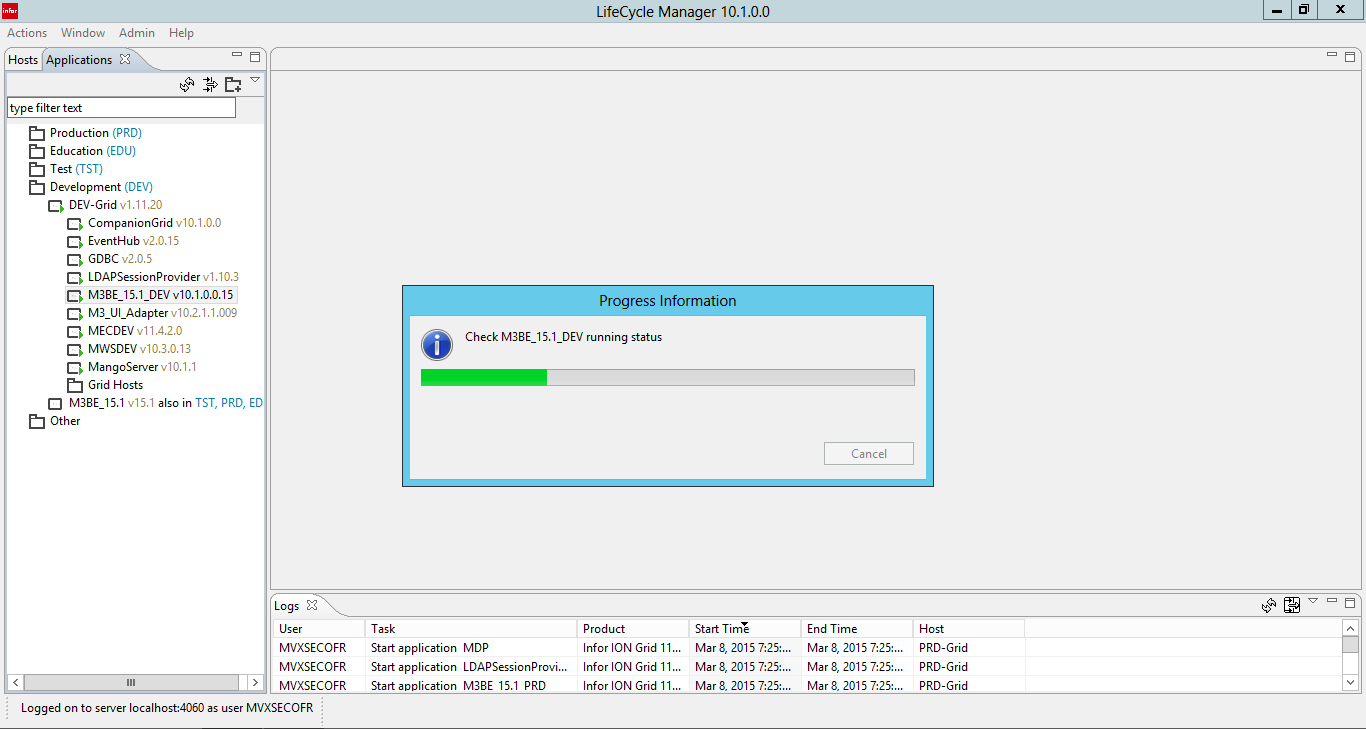
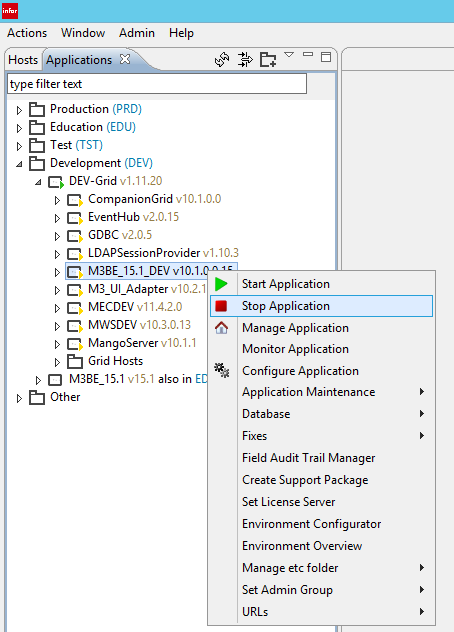
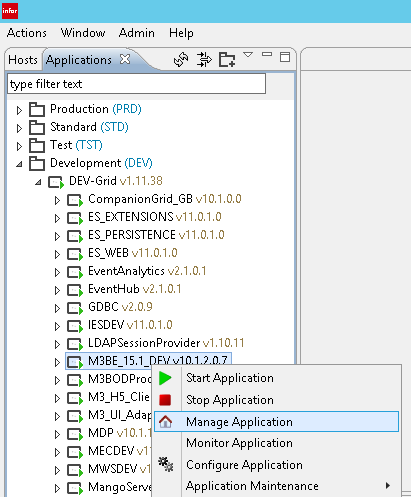
1. Log in to Life Cycle Manger, Right click on the BE node in desired environment and click on Manage Application.
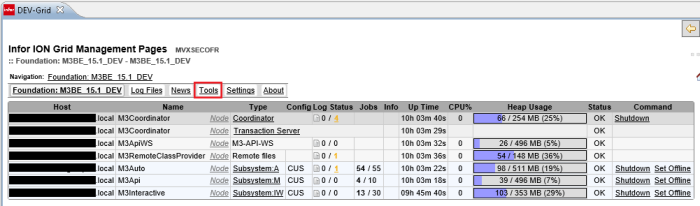
2. This will open up a tab that displays all the subsystems running in the business engine.
Setting up a dedicated Subsystem for our User Id
Note: All UI programs run in M3 Interactive subsystem where as MI programs (APIs) run in M3 API subsystem. M3 Auto subsystem handles Auto jobs. If we want to trace the functionality of CRS140 program we need to run the trace in M3 Interactive subsystem. However, at a given time many users will be using the system and M3 Interactive subsystem will have jobs from different users. If we run a trace in that subsystem, it will record data from all of those user interactions. Therefore I need to setup a dedicated subsystem for my user ID; so that it will only have jobs created by my user id.
3. Click on Tools.
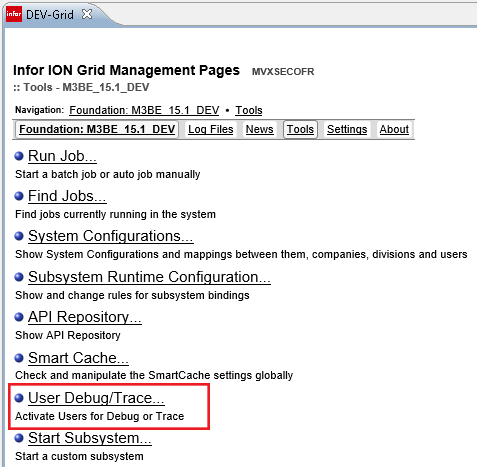
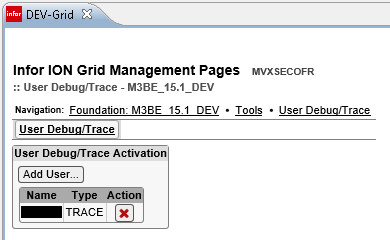
4. Click on User Debug/ Trace
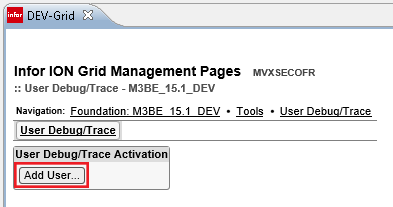
5. Click Add to add a user ID
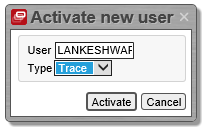
6. Put the you user id in User Text box, set Trace as the Type and click Activate.
7. A user will be added to the Debug/ Trace Activation List.
8. Now log in to Smart Office with your user id and go to CRS140 program.
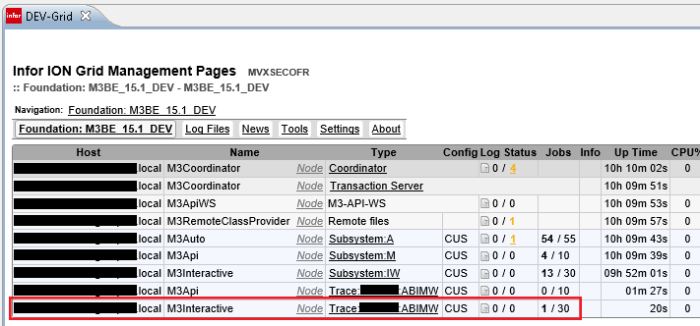
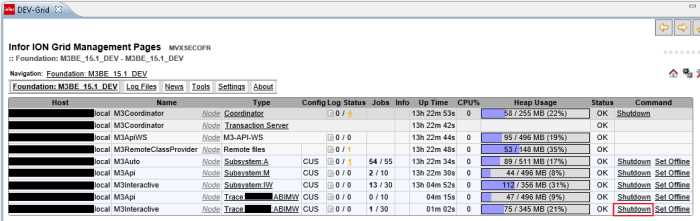
9. Go back to LCM and check the BE manage application screen. Now You should see a dedicated M3 Interactive subsystem created for your user id.
Enabling the Profiler
10. Now go in to newly spawned subsystem by clicking on type column of the relevant subsystem.
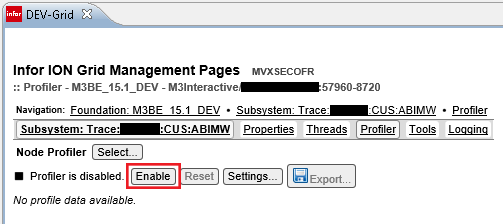
11. Click on Profiler.
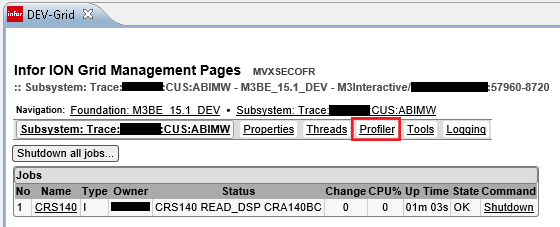
12. Then click on Enable on the next screen.
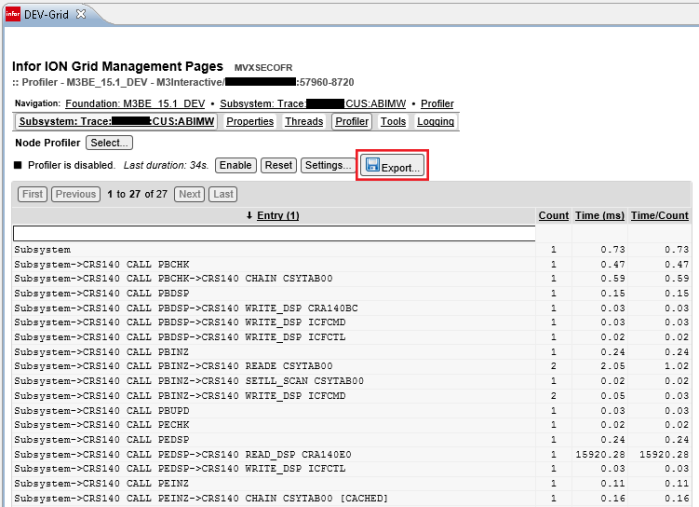
13. Now go in to M3 and create a record in CRS140 program. Once the record has been created, go back to LCM and Disable the profiler. Then it will create a list of tasks that the BE has performed in the back end while you were creating a record in CRS140.
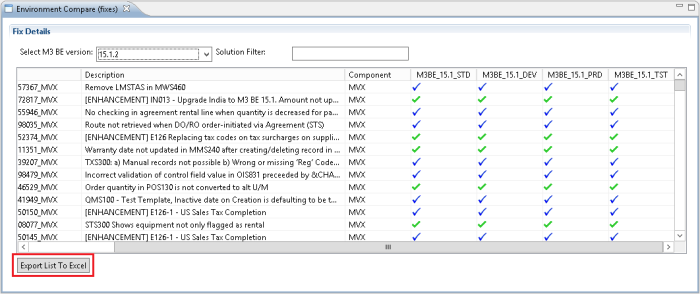
14. You can exporting this list of activities in to a CSV file for further analysis.
15. Once you have finished running the profiler, go back to User Debug/ Trace Activation screen and remove your user id from the list.
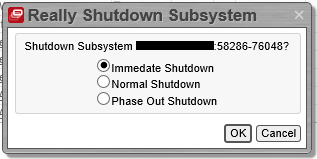
16. Then go to Manage Application Screen and Shutdown all dedicated subsystems that have been spawned for you user id.
You can use the same method to the trace the functionality of an API transaction as well. In that case you will have to enable the profiler in a M3 API subsystem instead of a M3 Interactive Subsystem.
Have a nice day…